Viewing Device Status on Monitor Page
The Web interface's Monitor page provides basic status and information on the device. The page is useful in that it allows you to easily obtain an overview of the device's operating status at a glance.
| ➢ | To view device status and information on the Monitor home page: |
| ■ | On the Menu bar, click Monitor or if you are already in the Monitor menu's Navigation tree, click |
The Monitor page displays the following groups of information:
| ■ | Top bar, displaying general device information: |
| ● | Address: IP address of the device's OAMP interface |
| ● | Firmware: Software version currently running on the device |
| ● | Type: Name of device |
| ● | HA Status: High-Availability (HA) status of the device, if configured for HA. For more information, see Viewing HA Status on Monitor Web Page. |
| ● | S/N: Serial number of device |
| ■ | SBC tab: |
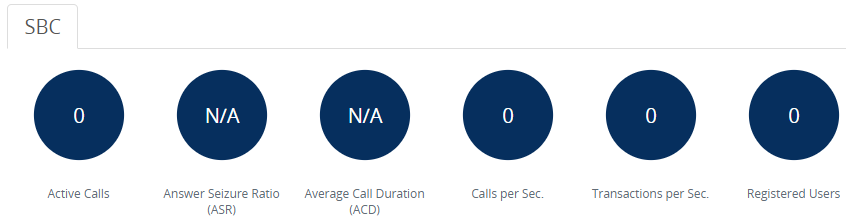
| ● | Active Calls: Displays the total number of currently active SBC calls. The corresponding SNMP performance monitoring MIB is acKpiSbcCallStatsCurrentGlobalActiveCallsIn. |
| ● | Answer Seizure Ratio (ASR): Displays the number of successfully answered calls out of the total number of attempted calls. The corresponding SNMP performance monitoring MIB is acKpiSbcCallStatsCurrentGlobalAnswerSeizureRatio. |
| ● | Average Call Duration (ACD): Displays the average call duration in seconds of established calls. The value is refreshed every 15 minutes and therefore, this value reflects the average duration of all established calls made within a 15 minute period. The corresponding SNMP performance monitoring MIB is acKpiSbcCallStatsCurrentGlobalAverageCallDuration. |
| ● | Calls per Sec: Displays the total number of new calls per second (CPS). |
| ● | Transactions per Sec: Displays the total number of new SIP transactions per second (out-of-dialog transactions such as INVITE and REGISTER, or in-dialog transactions such as UPDATE and BYE). The corresponding SNMP performance monitoring MIB is acKpiOtherStatsCurrentGlobalTransactionRate. |
| ● | Registered Users: Displays the percentage (%) of users currently registered with the device out of the device's maximum supported registered user capacity (regardless of any configurable limit). The corresponding SNMP performance monitoring MIB is acKpiOtherStatsCurrentGlobalRegisteredUsers. |
| ■ | GW tab: |
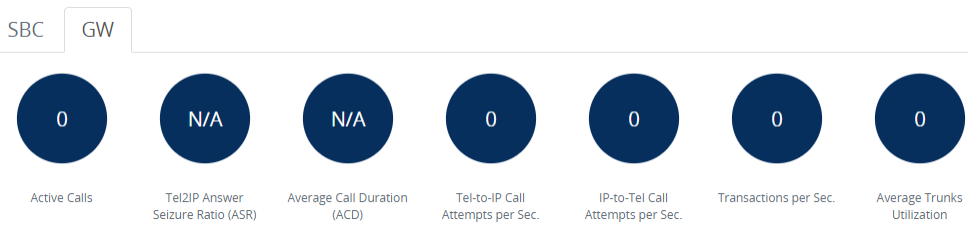
| ● | Active Calls: Displays the total number of currently active Gateway calls. The corresponding SNMP performance monitoring MIB is acKpiGatewayCallStatsIntervalGlobalActiveCallsMax. |
| ● | Tel-to-IP Answer Seizure Ratio (ASR): Displays the number of successfully answered Tel-to-IP calls out of the total number of attempted calls. The corresponding SNMP performance monitoring MIB is acKpiGatewayCallStatsIntervalGlobalAnswerSeizureRatioAvg. |
| ● | Average Call Duration (ACD): Displays the average call duration in seconds of established calls. The value is refreshed every 15 minutes and therefore, this value reflects the average duration of all established calls made within a 15 minute period. The corresponding SNMP performance monitoring MIB is acKpiGatewayCallStatsCurrentGlobalAverageCallDuration. |
| ● | Tel-to-IP Call Attempts per Sec.: Displays the current number of attempted Tel-to-IP calls per second. The corresponding SNMP performance monitoring MIB is acKpiGatewayCallStatsIntervalGlobalAttemptedCallsRateTel2IpAvg. |
| ● | IP-to-Tel Call Attempts per Sec: Displays the current number of attempted IP-to-Tel calls per second. The corresponding SNMP performance monitoring MIB is acKpiGatewayCallStatsIntervalGlobalAttemptedCallsRateIp2TelAvg. |
| ● | Transactions per Sec.: Displays the current number of SIP transactions per second (i.e., transaction rate). The corresponding SNMP performance monitoring MIB is acKpiGatewayOtherStatsCurrentGlobalTransactionRate. |
| ● | Average Trunks Utilization: Displays the average number of trunks currently in use (busy). Only SIP requests are considered in the SIP transaction count. For example, a single SIP transaction is from the initial SIP INVITE request to the final SIP 200 OK response. The corresponding SNMP performance monitoring MIB is acKpiTrunkStatsIntervalTrunkUtilizationAvg. |
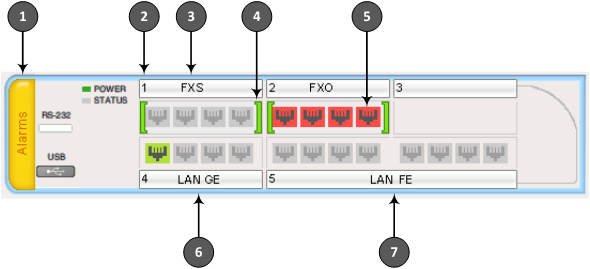
| ■ | Graphical Display of device: Shows color-coded status icons, as shown in the figure below and described in the subsequent table: |
Graphical Display of Device on Monitor Page - Mediant 800 Media Gateway & Enterprise Session Border Controller
Graphical Display of Device on Monitor Page - Mediant 800 Media Gateway & Enterprise Session Border Controller H/W Rev. C
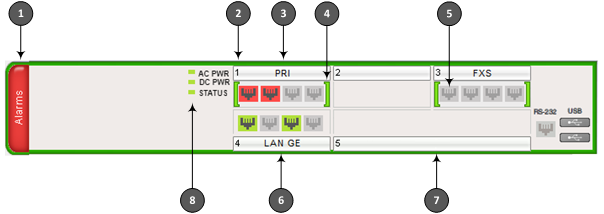
| ● | The figure above is used only as an example as the graphical display of your device in the Web interface reflects your specific ordered hardware configuration. |
| ● | For a description of the Monitor page when the device is in High Availability (HA) mode, see HA Status Display on Monitor Web Page. |
Description of Graphical Display of Device on Monitor Page
|
Item #1 |
Description |
||||||||||||||||||||||||||||||||||||||||||||||||||||||
|---|---|---|---|---|---|---|---|---|---|---|---|---|---|---|---|---|---|---|---|---|---|---|---|---|---|---|---|---|---|---|---|---|---|---|---|---|---|---|---|---|---|---|---|---|---|---|---|---|---|---|---|---|---|---|---|
|
1 |
Alarms: Displays the highest severity of an active alarm raised (if any) by the device:
To view active alarms, click Alarms to open the Active Alarms page (see Viewing Active Alarms). |
||||||||||||||||||||||||||||||||||||||||||||||||||||||
|
2 |
Module slot number. |
||||||||||||||||||||||||||||||||||||||||||||||||||||||
|
3 |
Module interface type. |
||||||||||||||||||||||||||||||||||||||||||||||||||||||
|
4 |
Module status icon:
|
||||||||||||||||||||||||||||||||||||||||||||||||||||||
|
5 |
Port analog channel status icon:
The port is physically connected to an FXS analog device (e.g., telephone), which is in idle state (i.e., on-hook position). -or- The port is not physically connected.
The port is not physically connected. -or- If the port is physically connected to an FXS analog device, it is out-of-service due to Serial Peripheral Interface (SPI) failure.
Port trunk status icon:
If you click a port, a shortcut menu appears with commands allowing you to do the following:
Note: For HA mode, the trunk status icons of the redundant device are not operational (i.e., displayed in gray color). |
||||||||||||||||||||||||||||||||||||||||||||||||||||||
|
6 |
Gigabit Ethernet port status icons:
To view detailed port information, click the port icon. For more information, see Viewing Ethernet Port Information. |
||||||||||||||||||||||||||||||||||||||||||||||||||||||
|
7 |
Fast Ethernet LAN port status icons. See above for description. |
||||||||||||||||||||||||||||||||||||||||||||||||||||||
|
8 |
Power icons indicating the type of power supply (i.e., AC and/or DC). Note: DC power is applicable only to Mediant 800 Media Gateway & Enterprise Session Border Controller H/W Rev. C. |
 (gray):
 (green): The FXS or FXO port is physically connected to an analog device, which is in off-hook state with an established call (i.e., active RTP stream).
 (red):
 (blue): The FXS or FXO port is physically connected to an analog device which is in off-hook state, but no established call.
 (yellow): The trunk has a Remote Alarm Indication (RAI), also known as the Yellow Alarm.
 (orange): The trunk has a D-channel alarm.
 (dark orange): The trunk has an NFAS alarm.